Asia/Pacific
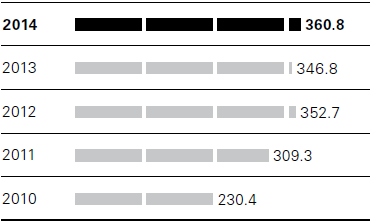
Sales Asia/Pacific (in EUR million)
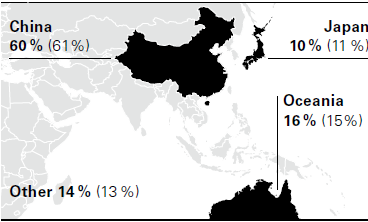
Share in sales Asia/Pacific 2014 (2013)
HUGO BOSS to assume full control of its store network in China and Macau
HUGO BOSS has been operating its network of stores in China and Macau completely on its own since June 30, 2014. Under the terms of the agreement reached, HUGO BOSS took over the remaining 40% stake in the “joint venture” established with the Rainbow Group in July 2010 effective June 30, 2014. This has given the Group full control of the 55 stores previously operated by the “joint venture” in mainland China and in Macau. Apart from the elimination of the Rainbow Group’s share of earnings, this did not affect the HUGO BOSS Group’s sales or earnings in fiscal year 2014. Notes to the Consolidated Financial Statements, Acquisition of non-controlling interests without change of control
In fiscal year 2014, sales in Asia/Pacific in the Group’s reporting currency, at EUR 361 million, were up 4% on the prior-year period (2013: EUR 347 million). In local currencies, sales in this region were up 7%.
The Group’s own retail business posts double-digit growth
Sales in the Group’s own retail business in this region rose by 7% in the reporting currency to EUR 295 million (2013: EUR 274 million). This is equivalent to growth of 10% compared to the prior-year period in local currencies. Sales with wholesale partners, at EUR 66 million, were down 8% year on year (2013: EUR 72 million), or a fall of 7% after currency adjustment.
Currency-adjusted sales growth in all markets
At EUR 215 million, sales in China were up 2% on the prior year (2013: EUR 211 million). Adjusted for currency effects, the sales increase was also 2%. The persistently difficult environment in the retail business burdened the development of sales here. In Oceania, sales of EUR 57 million represented an increase of 6% compared to the prior year (2013: EUR 53 million). Here, too, negative currency effects depressed sales in the reporting currency. Supported by significant productivity gains in the Group’s own retail business, sales increased by 13% after currency adjustments. At EUR 38 million, sales in Japan were down 3% on the prior-year level (2013: EUR 39 million), which, however, represented a sales increase of 5% after currency adjustments.
Profit development Asia/Pacific
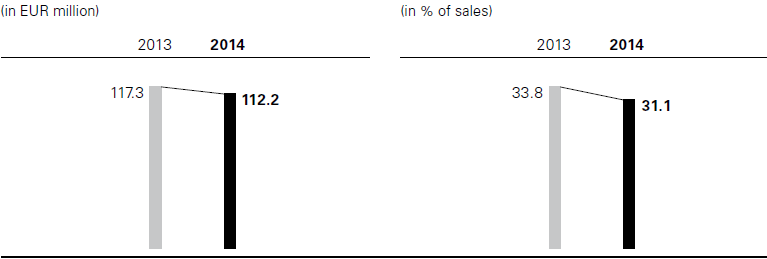
Segment profit for Asia/Pacific slightly below prior-year level
The segment profit for Asia/Pacific came to EUR 112 million, 4% down on the prior-year level (2013: EUR 117 million). This was mainly due to a disproportional increase in selling and marketing expenses particularly in connection with the expansion of the Group’s own retail business. At 31.1%, the adjusted EBITDA margin in this region was down 270 basis points from the prior year (2013: 33.8%).