Net assets
In fiscal year 2014, the development of the Group’s key financial reporting indicators was strongly influenced by the expansion of its own retail business. Investments into the sales network led to higher intangible assets, property, plant and equipment and inventories. Efficiency of capital employed, defined as the ratio of trade net working capital to sales, was above the level achieved at the end of 2013 as of the reporting date.
Statement of financial position as of December 31 (in %)
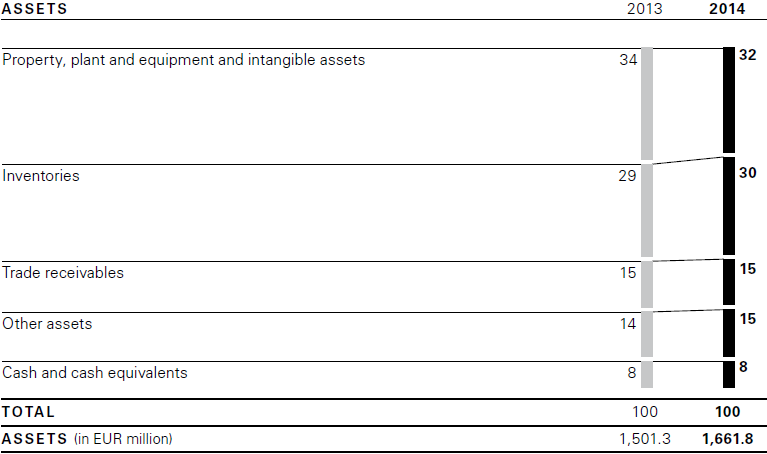
For absolute figures please refer to the statement of financial position
Increase in total assets due to higher inventories and property, plant and equipment and intangible assets
Total assets rose by 11% at the end of fiscal year 2014 year on year to EUR 1.662 million (December 31, 2013: EUR 1.501 million). This change was driven in particular by an increase in inventories and property, plant and equipment and intangible assets in connection with the expansion of the Group’s own retail business. The share of current assets increased compared to the prior year to 60% (December 31, 2013: 59%). The share of non-current assets fell accordingly from 41% in the prior year to 40% as of December 31, 2014.
Investments in retail business lead to rise in property, plant and equipment and intangible assets
Property, plant and equipment and intangible assets rose by 5% at the end of fiscal year to EUR 531 million (December 31, 2013: EUR 508 million). This was due to capital expenditure on the expansion and enhancement of the Group’s own retail business. Financial position, capital expenditure
Inventories as of December 31 (in EUR million)
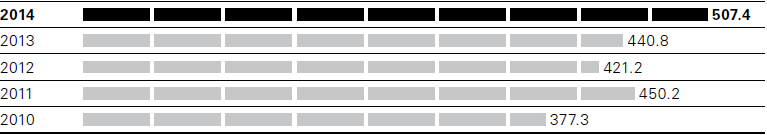
Expansion of Group’s own retail business drives up inventories
Inventories increased by 15% as of December 31, 2014 to EUR 507 million (December 31, 2013: EUR 441 million). After currency adjustments, inventories increased by 8% year on year. The higher volume of inventories was largely driven by the further expansion of the Group’s own retail business.
Trade receivables as of December 31 (in EUR million)
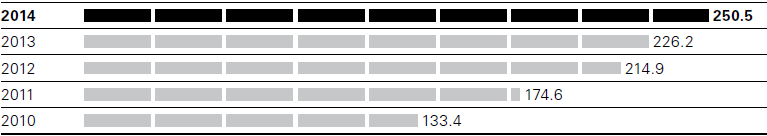
Increase in trade receivables
Trade receivables increased by 11% year on year to EUR 251 million (December 31, 2013: EUR 226 million). Adjusted for exchange rate effects, this corresponds to an increase of 7%. The rise was largely driven by a higher share than last year of deliveries in the wholesale business at the end of the reporting period and higher receivables in connection with the expansion of the concession model.
Other assets increased by 17% year on year to EUR 243 million (December 31, 2013: EUR 207 million). This development is mainly attributable to higher refund claims from returns and an increase in deferred tax assets because of additional temporary differences. Notes to the consolidated financial statements, Note 7
Cash and cash equivalents came to EUR 129 million as of the reporting date (December 31, 2013: EUR 119 million), principally due to the positive trend in free cash flow.
Statement of financial position as of December 31 (in %)
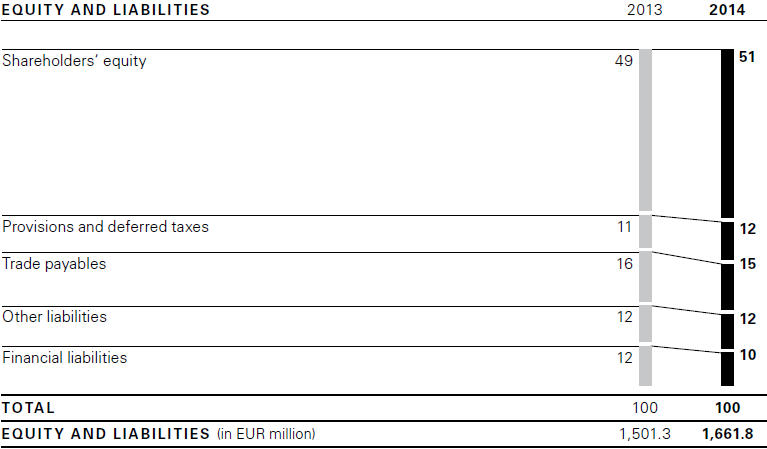
For absolute figures please refer to the statement of financial position
Increase in equity ratio to 51%
Equity increased as of the reporting date by 14% to EUR 844 million (December 31, 2013: EUR 740 million). The equity ratio thus increased to 51% as of the reporting date (December 31, 2013: 49%).
Provisions and deferred taxes, at EUR 196 million, were 15% higher than in the prior year (December 31, 2013: EUR 170 million). This includes provisions for pensions and other personnel expenses of EUR 91 million (December 31, 2013: EUR 83 million) as well as other provisions of EUR 95 million (December 31, 2013: EUR 69 million) and deferred tax liabilities of EUR 10 million (December 31, 2013: EUR 17 million). The increase in other provisions was essentially related to the early dissolution of the agreement with a trade agent in the Middle East and the closure of the production site in Cleveland, Ohio, which is scheduled for the first half of 2015. Notes to the consolidated financial statements, Note 25
Trade payables as of December 31 (in EUR million)
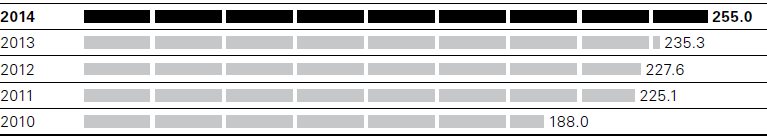
Higher trade payables
Trade payables increased by 8% year on year to EUR 255 million driven by quantity effects (December 31, 2013: EUR 235 million). After currency adjustments, this corresponds to a rise of 6%.
Other liabilities increased by 10% year on year to EUR 195 million (December 31, 2013: EUR 176 million) and, in addition to VAT liabilities and social security liabilities, mainly contain accruals of rental obligations for the Group’s own retail business as well accrued vacation, wages and salaries. The year-on-year change primarily results from an increase in the accruals of rental obligations and higher VAT liabilities.
The aggregate of current and non-current financial liabilities decreased as of the reporting date by 4% to EUR 172 million (December 31, 2013: EUR 179 million). This development principally resulted from the lower utilization of the syndicated loan of EUR 100 million (December 31, 2013: EUR 111 million). Apart from the tranches of the syndicated loan agreement drawn, the financial liabilities contain negative market values of interest and exchange rate hedges amounting to EUR 8 million (December 31, 2013: EUR 3 million).
Trade net working capital (in % of sales)
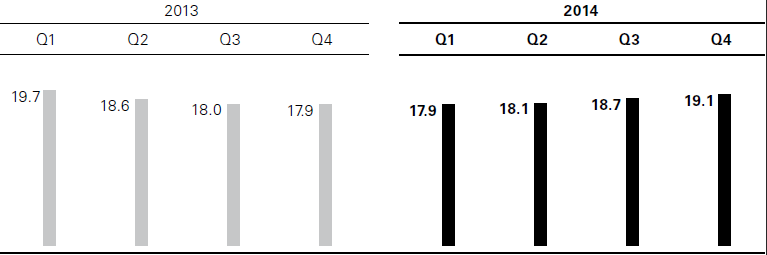
Trade net working capital as a percentage of sales above prior-year level
Trade net working capital is the HUGO BOSS Group’s key performance indicator for measuring the efficiency of capital employed. The only components factored into the calculation of this indicator are inventories, trade receivables and trade payables. Trade net working capital increased by 16% year on year to EUR 503 million (December 31, 2013: EUR 432 million), as a result of the increase in inventories and trade receivables. This could only be partially compensated by higher trade payables. The moving average of trade net working capital as a percentage of sales on the basis of the last four quarters, at 19,1%, was 120 basis points higher than in the prior year (2013: 17,9%).